
Capability demo
Organisation Brain
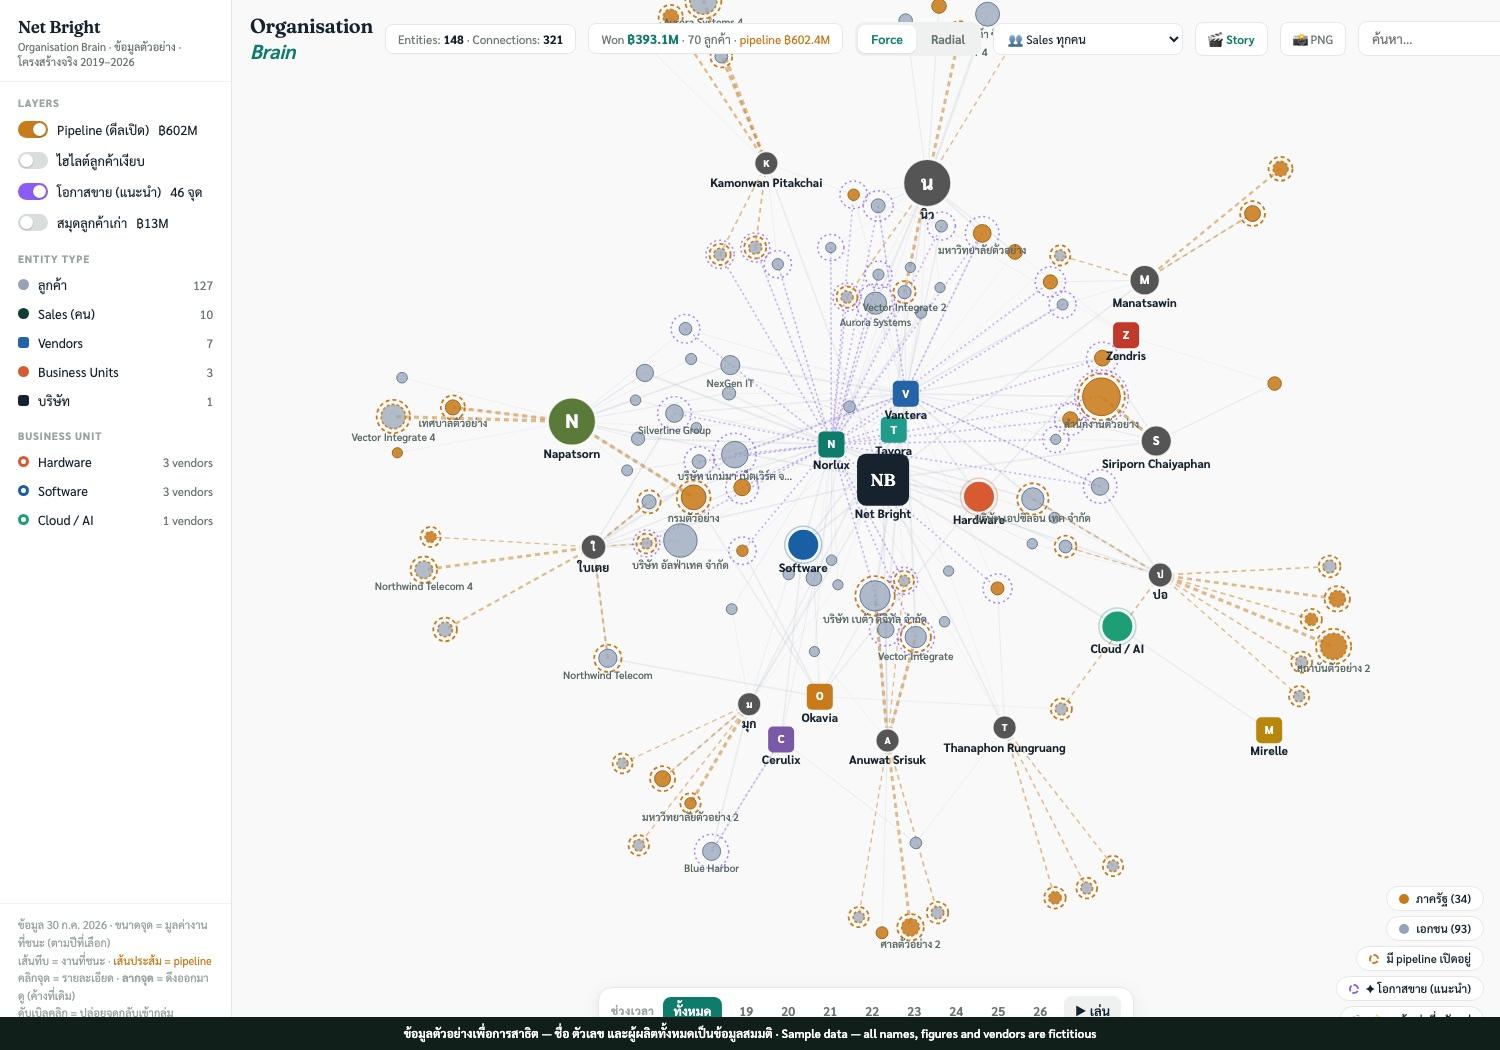
One picture of an entire company: every customer, who owns them, what they buy, what is still open, and how it all moved year by year.
This runs on sample data
The structure, the relationships and the year-by-year movement are real in shape, but every customer name, salesperson name and amount shown is invented. Nothing here is a real Net Bright account or figure.
What it does
- Reads the customer, deal and pipeline tables an organisation already has — no new system to adopt.
- Shows concentration risk at a glance: which accounts, which salespeople, which vendors carry the business.
- Surfaces the opportunities the data already implies — expiring renewals, customers missing a service contract, hardware due for refresh.
- Walks a viewer through the story year by year, so the point lands without a analyst in the room.
Want this on your own data?
We build it from the systems you already run — CRM, ERP, spreadsheets — and hand it over as something your team can open any day.
Talk to our teamDelivering Superior IT Solutions
Helping organizations achieve operational excellence through Infrastructure, Cybersecurity, Cloud, AI, and Managed Services.